Introduction:
For our final project, our group is scraping data from the Carleton Zoo books to identify students’ hometown poverty levels. One tool we came across was Social Explorer. This tool is useful for our project as it provides a comprehensive overview and interactive map to demonstrate the poverty levels of counties and cities across the United States. This tool is extremely useful for the Digital Humanities project as it is a great way to visualize US census data.
Tutorial:
One action I want to demonstrate is the ability to filter out the lowest poverty index in the United States by state.
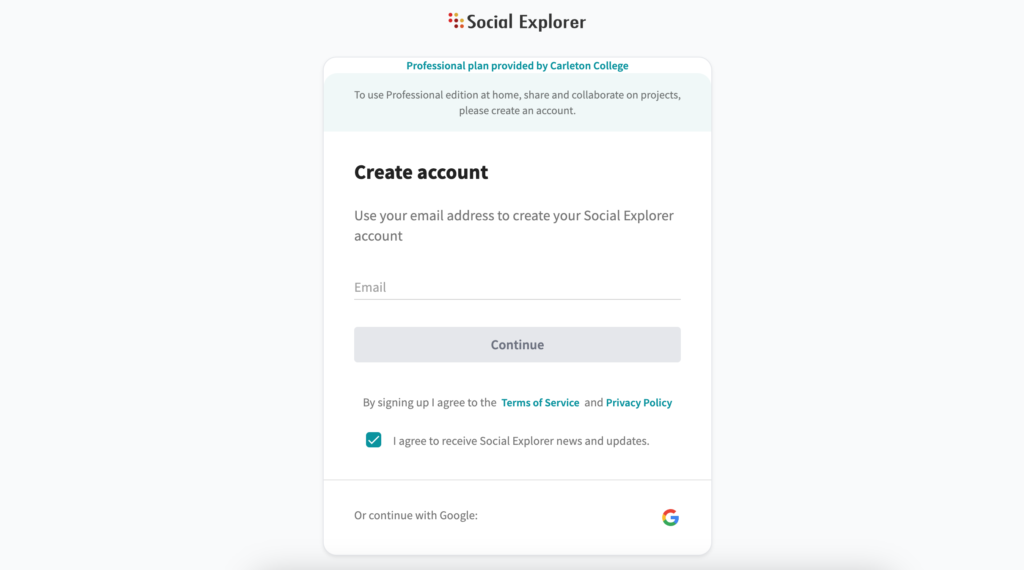
The first thing you want to do is register an account so it is easier to keep track of your progress by clicking the register button. If you are a student from Carleton College, then you will have a license to access the service for free.

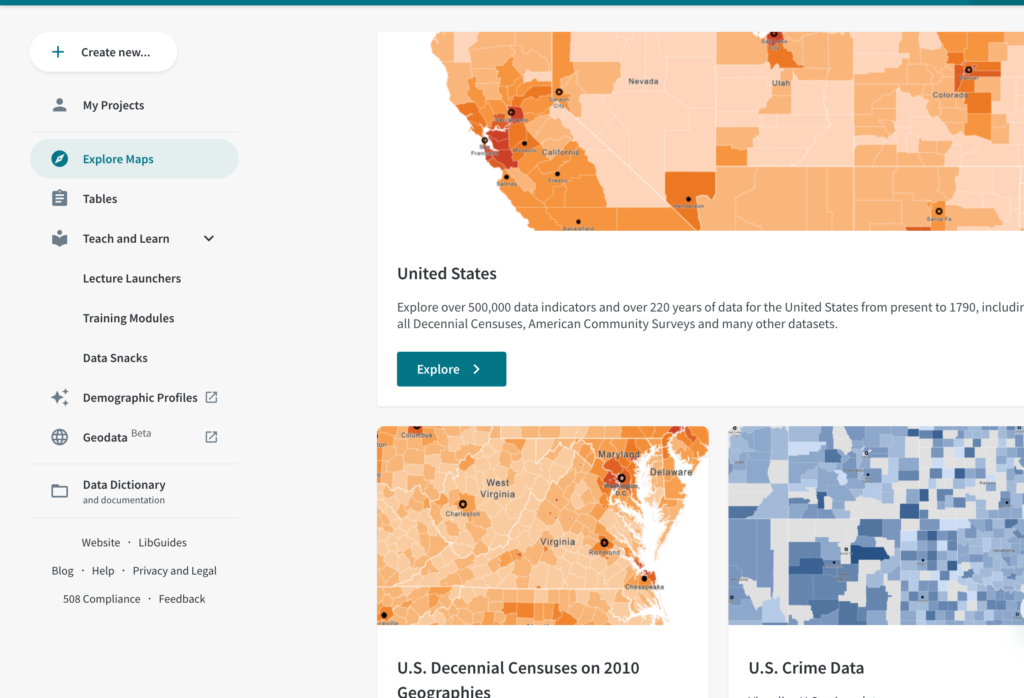
After registering an account and answering some questions, the next step is to select a map.
Below is a screenshot of this step. We will proceed with picking the first option for this tutorial, the general United States app.

We will then proceed to process a filter for our website. In this case, we will filter by state.

In the dropdown on the left side, we will pick the second item which will be state.
Next, we want to explore changes over time, so we will choose the -5 years options. Below is a screenshot of what that looks like:

Finally, we will change the color palette of our map to our liking. Below is a screenshot of this process.

To access this page, click percent change and you will see the option to change the color palette
At this point, we can navigate through the map of the United States to conduct data analysis that fits your research.
Conclusion:
I strongly believe this tool can be extremely useful for Digital Humanities projects, especially those focused on US census data.
There are many of documentation about this tool, below are some potential links you can use to research more.
Hi! Your tutorial is a great introduction to using Social Explorer for analyzing poverty levels across the U.S. The step-by-step instructions, along with screenshots, make it easy to follow. I appreciate how you highlight key features like filtering by state, exploring changes over time, and customizing the map. It’s a fantastic resource for Digital Humanities projects. Great work!