Robots Reading Vogue is a digital humanities project led by Yale University Library, exploring interdisciplinary intersections across art, statistics, and beyond. The project aims to categorize and synthesize trends in the leading fashion magazine Vogue. With over 2700 covers, 400,000 pages, and 6 TB of data, this project was able to synthesize trends in word vectors, colorimetric space, advertisements, and more from the magazine series.
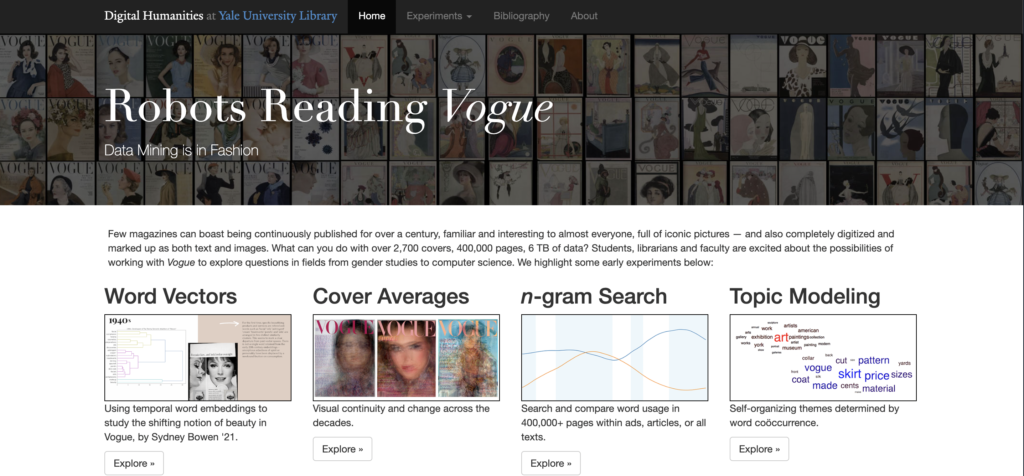
Of the trends explored in this project, I found the synthesis of “Vogue Covers in Colormetric Space” especially interesting. This small project aimed to quantitatively visualize how colorful Vogue covers were over time. A scatterplot of time against saturation was created with an interactive interface so you can zoom in and observe the specific covers being analyzed.
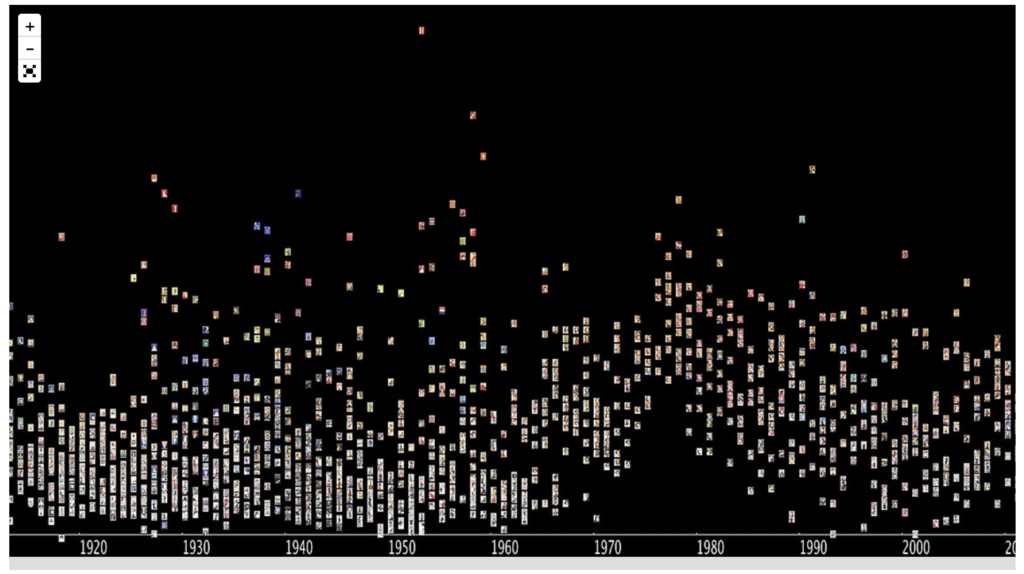
This project utilized data from Vogue Archive, which is a dataset that can be purchased from ProQuest(Sources). Every small research topic utilized either pre-existing digital tools or created their own digital method to synthesize the data(Processes). For example, “Vogue Covers in Colormetric Space” used ImagePlot, a tool developed by Lev Manovich. At last, a visualization of the research is presented to us in some shape or form(Presentation).
As I’m writing this I’m realizing that the processes and presentation step can somewhat merge together depending on the tool you’re using. In the case of “Vogue Covers in Colormetric Space,” it seemed like the tool was smart enough to both process and present the data for you as long as you inputted the dataset. I wonder if this is common in digital humanities projects or was this just an outlier.
